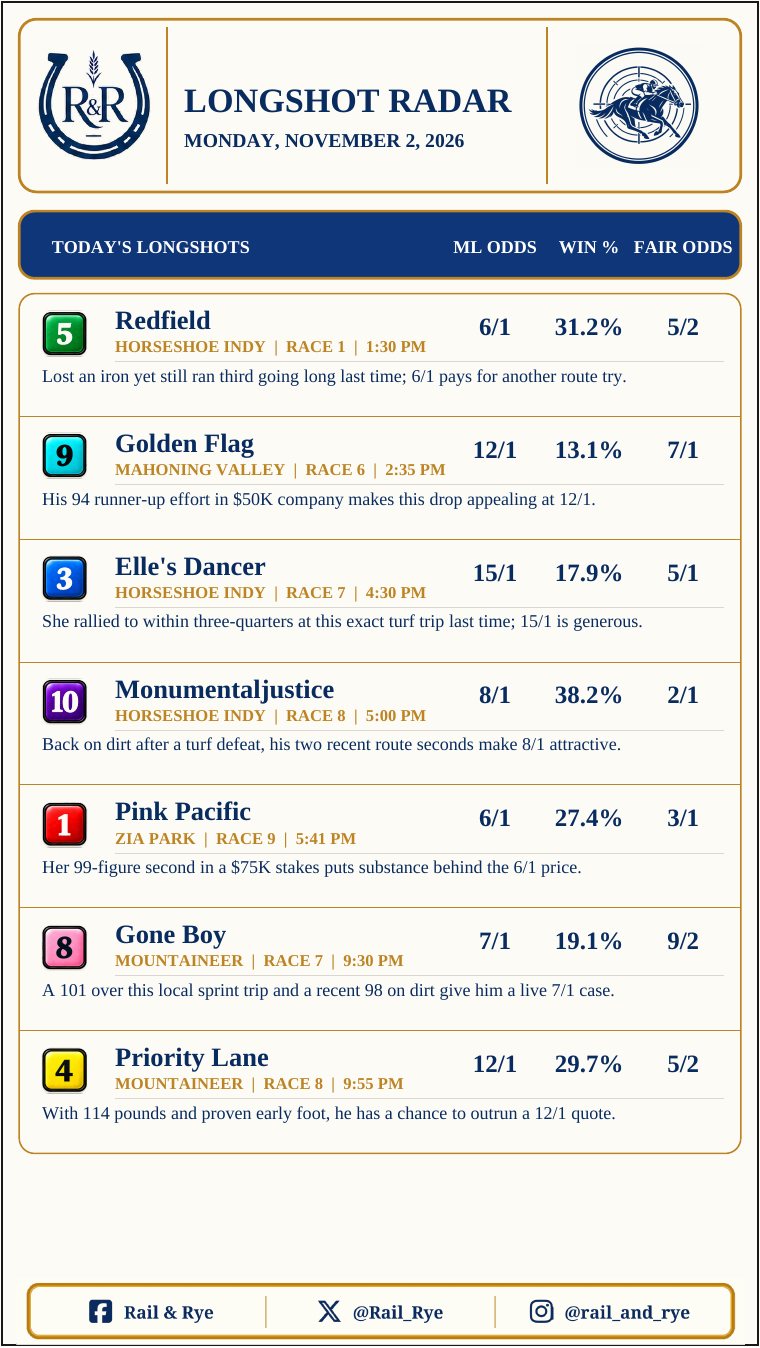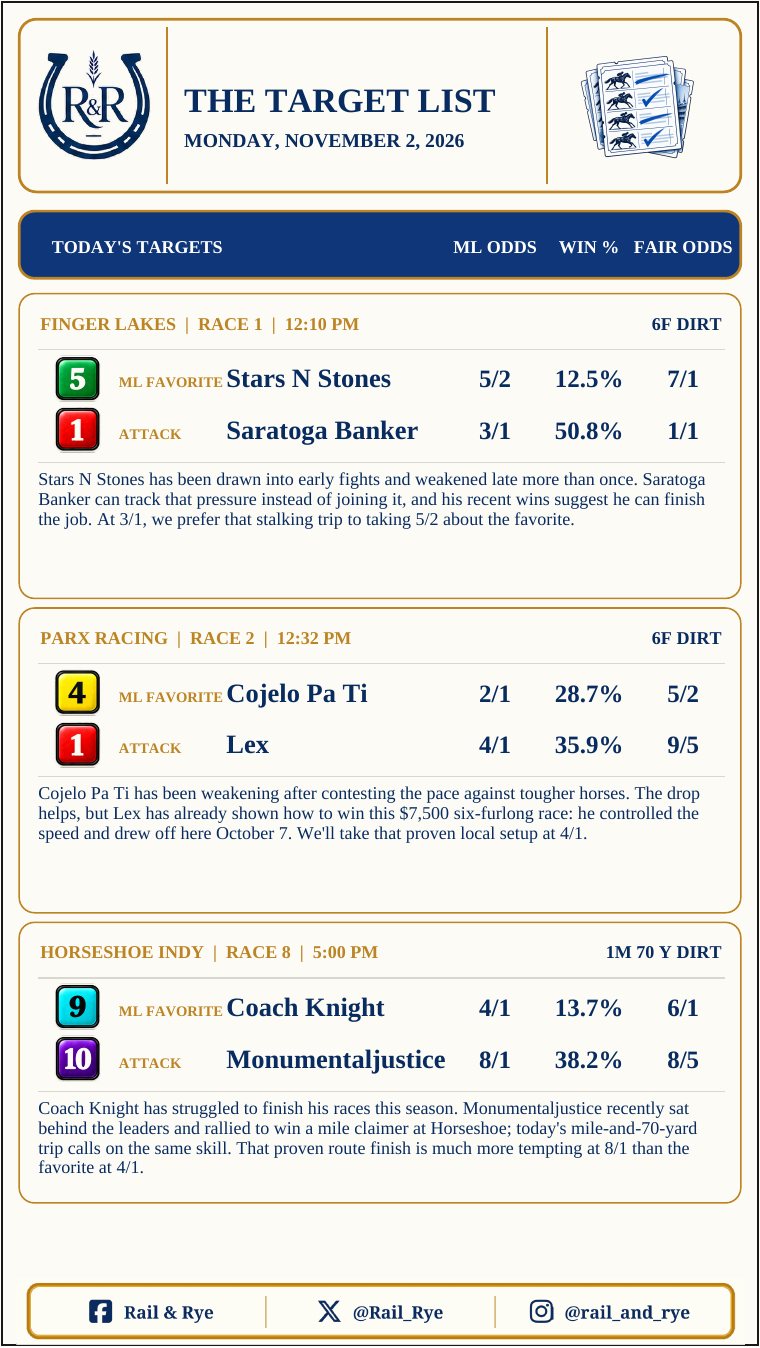
Our flagship: read the whole field.
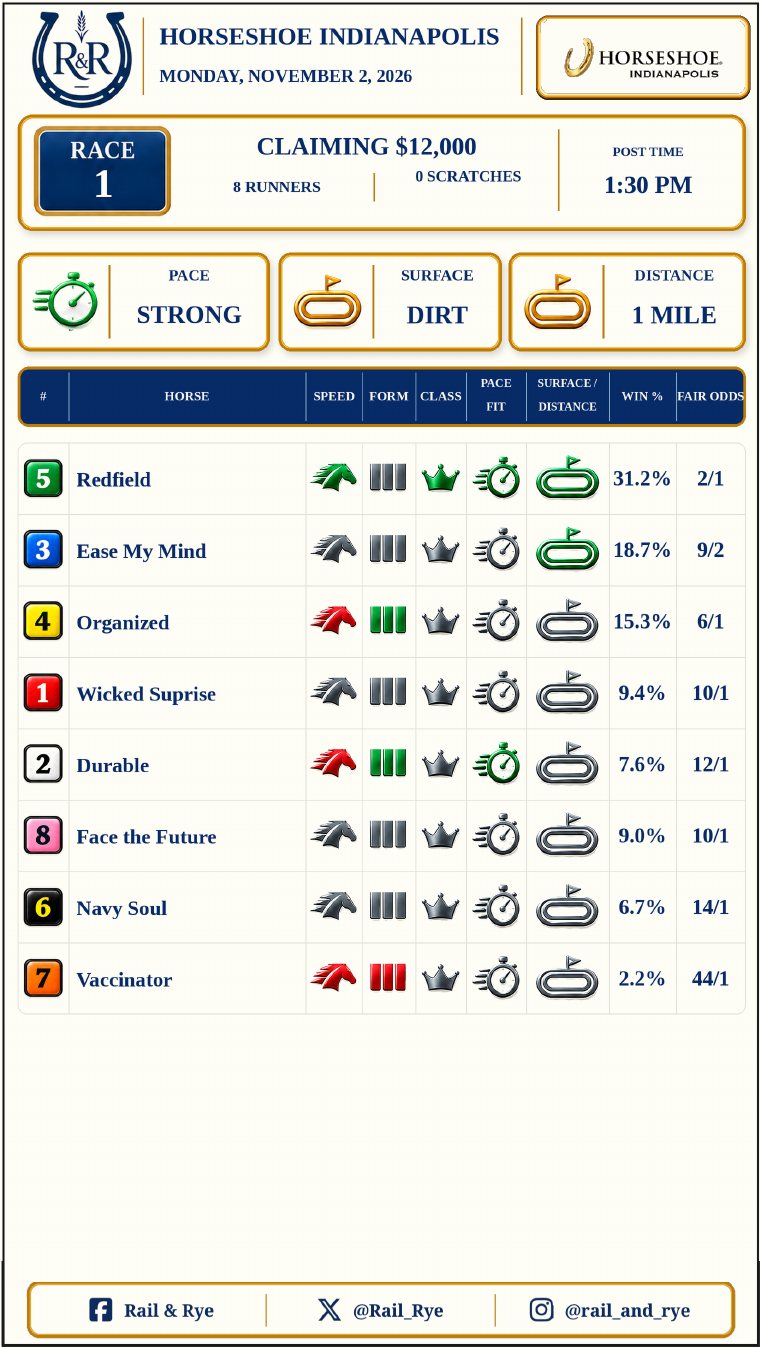
Each track-specific Race Card starts with the race in front of you: its conditions, pace picture and active field. Then PWIN estimates every runner’s chance of winning, with field-level context and visual ratings beside it.
- 1
Race identity
Track, date, race number, class, post time and field status tell you exactly which contest you’re looking at.
- 2
How the race sets up
Pace strength, surface and distance provide a compact read on the conditions each runner will face.
- 3
Compare the whole field
Speed, form, class, Pace Fit and Surface/Distance cues help you inspect the race. WIN% and Fair Odds show the separate PWIN probability output.
A whole-field estimate, built horse by horse.
PWIN estimates each runner’s chance of winning. It combines 79 pre-race features—built from race-card and past-performance data, condition fit, pace, recency and verified connections—then evaluates every horse against today’s field.
Speed and form
Recent, best and 90-day speed evidence; same-surface and similar-distance performance; field-relative strength; trends, variability and how much history supports the estimate.
Surface and distance fit
Today’s surface, route or sprint, and distance are compared with relevant past starts. The model accounts for similarity, sample size, stretch-outs, cutbacks and sprint-to-route or route-to-sprint changes.
Expected pace and matchup
Early and late pace signals are read together, with surface and distance interactions. Pace matters in context: early speed is not an automatic bonus, and late strength depends on the race shape.
Trainer and jockey context
Source-checked trainer, jockey and partnership ratings are paired with their supporting sample sizes and win or in-the-money records. Known, limited and unavailable evidence is kept distinct.
Recency, development and reliability
Age and development status, days since the last race, freshness of the evidence, relevant-start counts, figure variability and uncertainty help distinguish a strong signal from a thin record.
The field itself
Field size and each runner’s performance relative to the other entrants matter. PWIN is a race-level distribution, not a reusable rating that ignores who else is entered.
How to read the order: runners are listed by projected-win rank; saddlecloth numbers identify the horses, not their rank. WIN% is each runner’s estimated share of the win probability, normalized across the active field (about 100% total after display rounding). Fair Odds translate that estimate into an odds reference. A projected rank is a comparison, not a promised finishing order.
Independent PWIN: the morning line and current market odds are not model inputs. PWIN is built from evidence available before the race. Historical results measure how prior estimates performed; the outcome of the race being predicted cannot enter its own probability.