

Inside the Rail & Rye Race Card: The Work Behind Every Number
A race card brings race conditions, horse history, pace, surface and distance evidence, and 79 pre-race inputs into one clear view—while keeping win probability, projected order, and fair odds distinct.
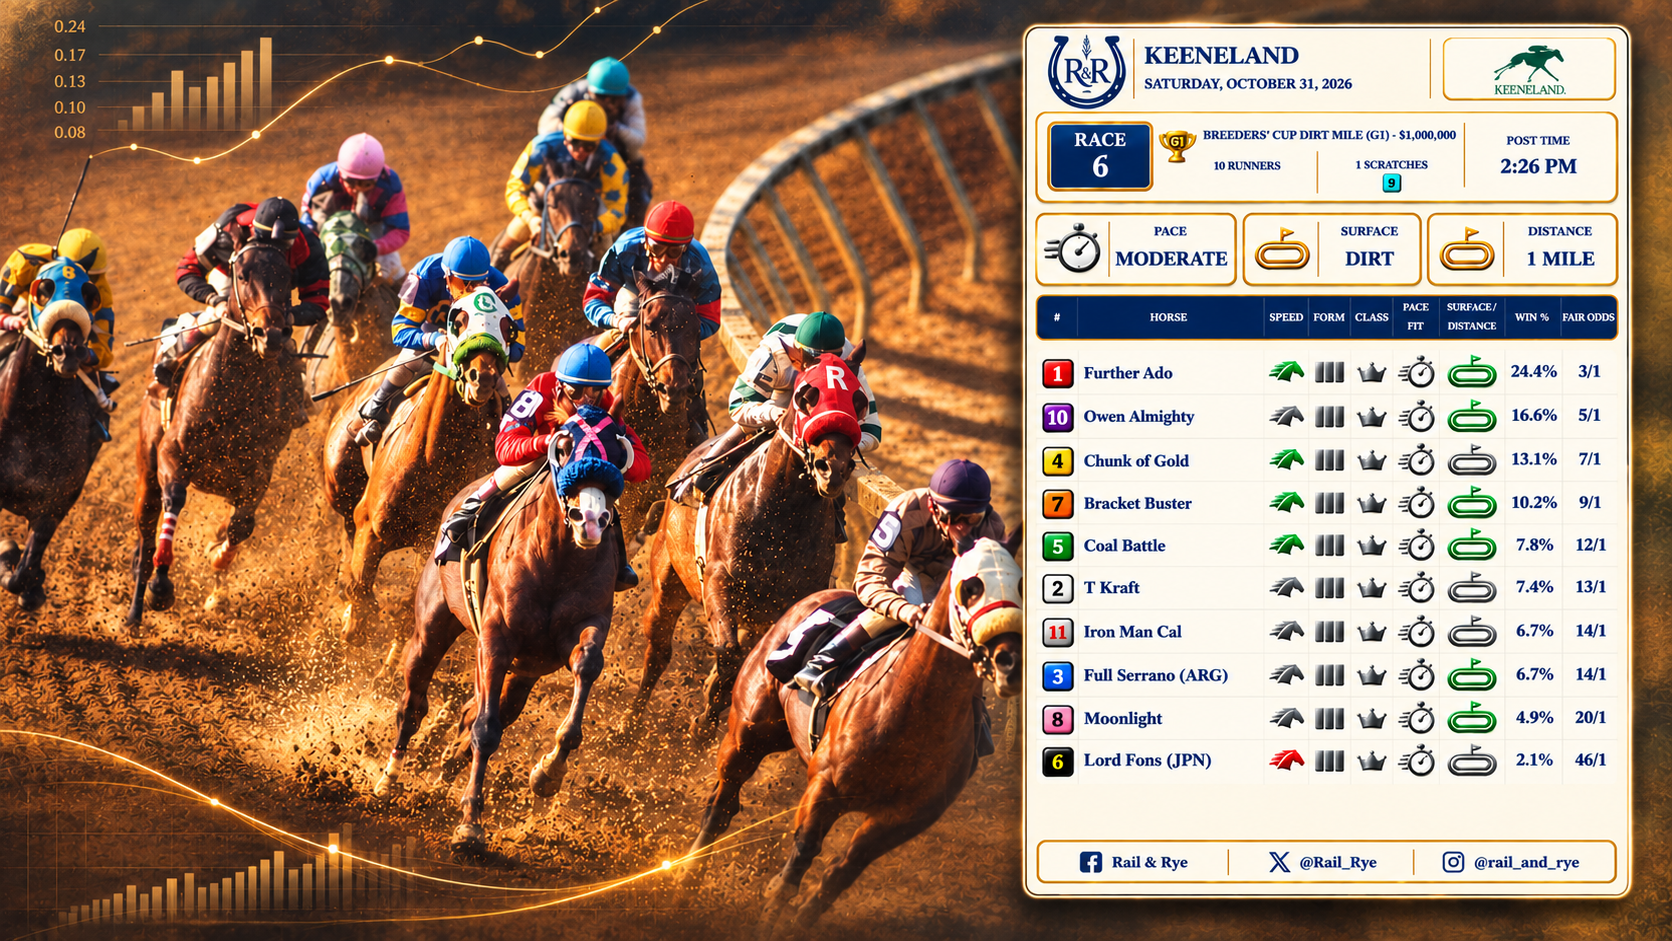
A race is never just a list of horses. It is a field full of powerful athletes asked to do a particular thing, over a particular distance, on a particular surface, against particular rivals. The card starts there.
The track, date, race, distance, surface, expected pace, post time and scratches establish the terms of the contest. Change the surface or distance and you have changed the test. Take a likely pace horse out of the field and you may have changed the race itself.
Rail & Rye’s card is built from information available before the race: past performances, speed and pace figures, workouts, race conditions, and the field as entered. Results are reviewed separately afterward to measure how well the model performed. What happens at the finish can help us judge a forecast, audit the model and make improvements.
The evidence behind each horse
The model’s PWIN calculation uses a fixed set of 79 pre-race features. The card does not print all 79 as separate numbers. It gathers them into a few readable indicators and a probability estimate.
Those features draw on a horse’s prior speed and pace figures; the reliability of those figures; recent form and consistency; the horse’s best and more recent performances; starts, age and development; days since the last race; and workouts. They also account for the class and conditions of today’s assignment, carried weight, surface and distance experience, running style, the expected pace pressure, and the makeup of the field.
Trainer and jockey information is included when it is supported by verified, comparable source data. When a rating is missing, the model does not invent one. The horse’s identity and the source record have to match, too; a number attached to the wrong horse is worse than no number at all.
The small indicators on the card are meant to help a reader see where the case for a horse comes from:
Speed puts past performance figures in the context of the field. A fast number matters, but so do the conditions under which it was earned and whether the figure is dependable.
Form looks at a horse’s recent races as a sequence: how it has been running, whether its efforts are consistent, and how much time has passed since each one.
Class sets earlier competition beside today’s race. A horse’s finish means more when the level and circumstances of that race are understood.
Pace Fit considers how a horse’s running style may suit the likely shape of this race.
Surface/Distance focuses on evidence tied to today’s ground and trip. A horse’s record on turf at a mile, for example, may tell us more about today’s task than its undivided career record. A thin record is still a thin record; it is not proof that the horse cannot handle the assignment.
These indicators make a crowded card easier to read. They are evidence summaries, not promises.
Pace belongs to the whole field
Expected pace is not simply a label for one horse. It is an estimate of how the field may run together.
The model considers early-speed evidence and likely running positions across the entrants. If several horses have reason to go forward, they may put one another under pressure. If one horse is likely to get the lead without much company, that can change the advantage. A horse that settles behind the leaders may benefit from a demanding pace; a closer still needs enough pace ahead and a path through the field.
That is why pace fit depends on the other horses entered. The same runner can face a different problem in a different field. Surface and distance matter here as well: prior evidence on dirt, turf, synthetic ground and comparable trips helps describe what kind of race the horse is being asked to run.
PWIN: Projected Winning Percentage
PWIN answers one question: given this field and the evidence available before the race, what chance does the model assign each horse to win?
The 79 inputs are combined into a win-probability distribution across the starters. A 20% PWIN means the model assigns that horse one-fifth of the win probability in the race as modeled. It does not mean the horse is expected to finish second. It does not mean a win is due.
The morning line and live tote odds are not inputs to PWIN. The model’s estimate is kept separate from the price offered by the market.
**Finishing Order ** PWIN and the row order give you different information. PWIN estimates the chance of winning. A different model estimates comparative finishing position, and the card’s rows are arranged by that projected order.
A horse can rank well in projected finishing order without having the highest chance to win. The distinction is key in a large field, where several runners may have plausible paths to first and a horse may be more likely to finish near the front than to win outright.
This ordering changes the arrangement of the runners; it does not replace the PWIN probabilities or the fair odds. One is the chance to win. The other is the model’s view of how the field may finish.
Fair odds and the price on race day
Fair odds translate PWIN into a break-even price. A 20% win probability corresponds to fair odds of 4–1. That is the model’s mathematical translation of its probability—not the morning line and not a prediction of the final betting price.
Read the card in order
First, confirm the race conditions and the field. Then consider the expected pace and the evidence shown by the runner indicators. Read the row order as F4’s projected finishing order. Read PWIN as the chance to win. Use fair odds to understand the price implied by that chance.
Scratches can alter the pace and the shape of a race. Track conditions can change, too. A card describes the information available when it was prepared, so a later card should be used when an updated version is posted.
The work behind the card is an effort to make the reasoning legible: what the race asks, what the horses have done, and how the model separates a chance to win from a projected finish. It is independent research.